Market Outlook
November 17, 2017
Market Cues
Domestic Indices
Chg (%)
(Pts)
(Close)
Indian markets are likely to open Positive tracking global indices and SGX Nifty.
BSE Sensex
1.1
346
33,107
U.S. stocks closed higher Thursday, with earnings-inspired gains by Cisco and Wal-
Nifty
1.0
97
10,215
Mart helping to set the pace, while House passage of a Republican-sponsored tax
Mid Cap
1.1
175
16,504
cut plan helped cement the rally. The Dow Jones Industrial Average DJIA, ended
Small Cap
1.1
189
17,463
with a gain of 0.8%, at 23,458 after rising as much as 221 points earlier in the
Bankex
1.0
278
28,902
session. The S&P 500 SPX climbed 0.8%, to finish at 2,585. The tech-heavy
NASDAQ jumped 1.3%, to finish at a record 6,793.
Global Indices
Chg (%)
(Pts)
(Close)
U.K. stocks closed higher on Thursday, boosted by a round of well-received
Dow Jones
0.8
187
23,458
corporate updates and as buyers stepped in to pick up shares after a five-session
losing streak. The FTSE 100 added 0.2% to end at 7,387.
Nasdaq
1.3
87
6,793
FTSE
0.2
14
7,387
Indian shares staged a strong comeback on Thursday after three days of losses, with
Nikkei
1.5
323
22,351
firm global cues and expectations for further rationalization of Goods and Services
Tax (GST) rates supporting underlying sentiment. The benchmark BSE Sensex
Hang Seng
0.6
167
29,019
jumped 1.06 % to finish at 33,107 while the Nifty index ended up 0.96% at 10,215.
Shanghai Com
(0.1)
(3)
3,399
News Analysis
Advances / Declines
BSE
NSE
Moody’s Upgrades India’s Sovereign Rating to Baa2 from Baa3, Outlook on
Advances
1,684
1,147
the rating is 'stable'.
Declines
1,013
581
Detailed analysis on Pg2
Unchanged
150
66
Investor’s Ready Reckoner
Volumes (` Cr)
Key Domestic & Global Indicators
BSE
3,894
Stock Watch: Latest investment recommendations on 150+ stocks
Refer Pg5 onwards
NSE
28,951
Top Picks
Net Inflows (` Cr)
Net
Mtd
Ytd
CMP
Target
Upside
Company
Sector
Rating
(`)
(`)
(%)
FII
2,681
12,283
50,735
Blue Star
Capital Goods
Buy
698
867
24.2
MFs
2,326
3,825
99,236
Dewan Housing Finance
Financials
Accumulate
624
712
14.2
Asian Granito
Other
Buy
480
570
18.9
Top Gainers
Price (`)
Chg (%)
Navkar Corporation
Other
Buy
182
265
45.3
KEI Industries
Capital Goods Accumulate
339
380
12.2
Rcom
12
16.3
More Top Picks on Pg4
Rtnpower
7
15.5
Fsl
40
10.3
Key Upcoming Events
Religare
51
10.0
Previous
Consensus
Date
Region
Event Description
Reading
Expectations
Hindcopper
97
9.2
Nov16
US
Industrial Production
0.28
0.50
Nov16
US
Building permits
1,225.00
1,250.00
Top Losers
Price (`)
Chg (%)
Nov16
Germany GDP nsa (YoY)
2.30
Nov17
US
Existing home sales
5.39
5.41
Fortis
131
(6.8)
Nov17
Euro Zone Euro-Zone Consumer Confidence
(1.00)
Welcorp
132
(5.0)
More Events on Pg7
Balkrisind
2,070
(4.1)
Rnaval
42
(3.9)
Amarajabat
793
(3.4)
As on November, 16 2017
Market Outlook
November 17, 2017
News Analysis
Moody’s Upgrades India’s Sovereign Rating to Baa2 from Baa3,
Outlook on the rating is 'stable'.
Moody’s Investors Service has upgraded India’s sovereign rating for the first time
since 2004, citing continued progress in the nation’s economic and institutional
reforms. The rating agency on Monday upgraded India's rating to Baa2 from
Baa3. The outlook on the rating is 'stable'.
Explaining the rationale behind the upgrade, Moody’s said reforms being pushed
by the government will help stabilize debt and enhance the country’s growth
potential.
“The decision to upgrade the ratings is underpinned by Moody’s expectation that
continued progress on economic and institutional reforms will, over time, enhance
India’s high growth potential and its large and stable financing base for
government debt, and will likely contribute to a gradual decline in the general
government debt burden over the medium term.”
Economic and Political News
Inflation may ease by December: Rangarajan
GST: Cabinet approves setting up of Anti-Profiteering Authority
Centre Increases Carpet Area of Houses Under Pradhan Mantri Awas
Yojana
Seven States Submit Proposals for ‘Power for All’ Scheme
Corporate News
Ashok Leyland to acquire 4.68% stake in Hinduja Leyland Finance at `110
per share, valued at `225.42cr. Increases stake to 61.9%.
Bank of Baroda to consider raising up to `6,000cr through a QIP, Rights
Issue on Nov. 21.
RBI said FPI limit In ICICI Lombard increased to 49% from 24%
Mercator aims to begin oil production by H1 2018 at Cambay basin oil
block.
Market Outlook
November 17, 2017
Top Picks HHHHH
Market Cap
CMP
Target
Upside
Company
Rationale
(` Cr)
(`)
(`)
(%)
Strong growth in domestic business due to its leade`hip
in acute therapeutic segment. Alkem expects to launch
Alkem Laboratories
23,515
1,967
2,125
8.0
more products in USA, which bodes for its international
business.
We expect the company would report strong profitability
Asian Granito
1,443
480
570
18.9
owing to better product mix, higher B2C sales and
amalgamation synergy.
Favorable outlook for the AC industry to augur well for
Cooling products business which is out pacing the
Blue Star
6,690
698
867
24.2
market growth. EMPPAC division's profitability to
improve once operating environment turns around.
With a focus on the low and medium income (LMI)
consumer segment, the company has increased its
Dewan Housing Finance
19,553
624
712
14.2
presence in tier-II & III cities where the growth
opportunity is immense.
Loan growth is likely to pick up after a sluggish FY17.
Lower credit cost will help in strong bottom-line growth.
Karur Vysya Bank
7,110
118
180
53.0
Increasing share of CASA will help in NIM
improvement.
High order book execution in EPC segment, rising B2C
KEI Industries
2,654
339
380
12.2
sales and higher exports to boost the revenues and
profitability
Expected to benefit from the lower capex requirement
Music Broadcast
2,111
370
434
17.3
and 15 year long radio broadcast licensing.
Massive capacity expansion along with rail advantage
Navkar Corporation
2,745
182
265
45.3
at ICD as well CFS augur well for the company
Strong brands and distribution network would boost
Siyaram Silk Mills
2,609
557
650
16.7
growth going ahead. Stock currently trades at an
inexpensive valuation.
Market leadership in Hindi news genre and no.
2
viewership ranking in English news genre, exit from the
TV Today Network
2,098
352
435
23.7
radio business, and anticipated growth in ad spends by
corporate to benefit the stock.
After GST, the company is expected to see higher
volumes along with improving product mix. The Gujarat
Maruti Suzuki
2,46,664
8,166
8,890
8.9
plant will also enable higher operating leverage which
will be margin accretive.
We expect loan book to grow at 24.3% over next two
GIC Housing
2,275
422
655
55.0
year; change in borrowing mix will help in NIM
improvement..
Source: Company, Angel Research
Market Outlook
November 17, 2017
Key Upcoming Events
Global economic events release calendar
Bloomberg Data
Date
Time Country
Event Description
Unit
Period
Last Reported
Estimated
Nov 17, 2017
7:45 PMUS
Industrial Production
%
Oct
0.28
0.50
7:00 PMUS
Building permits
Thousands
Oct
1,225.00
1,250.00
Nov 21, 2017
12:30 PMGermany
GDP nsa (YoY)
% Change
3Q F
2.30
Nov 22, 2017
8:30 PMUS
Existing home sales
Million
Oct
5.39
5.41
Nov 23, 2017
8:30 PMEuro Zone
Euro-Zone Consumer Confidence
Value
Nov A
(1.00)
2:00 PMGermany
PMI Services
Value
Nov P
54.70
2:00 PMGermany
PMI Manufacturing
Value
Nov P
60.60
3:00 PMUK
GDP (YoY)
% Change
3Q P
1.50
Nov 27, 2017
8:30 PMUS
New home sales
Thousands
Oct
667.00
615.00
Nov 28, 2017
8:30 PMUS
Consumer Confidence
S.A./ 1985=100
Nov
125.90
123.00
Nov 29, 2017
7:00 PMUS
GDP Qoq (Annualised)
% Change
3Q S
3.00
3.40
Nov 30, 2017
2:25 PMGermany
Unemployment change (000's)
Thousands
Nov
(11.00)
6:30 AMChina
PMI Manufacturing
Value
Nov
51.60
Dec 01, 2017
3:00 PMUK
PMI Manufacturing
Value
Nov
56.30
Dec 05, 2017
2:30 PMIndia
RBI Reverse Repo rate
%
Dec 6
5.75
Dec 06, 2017
3:30 PMEuro Zone
Euro-Zone GDP s.a. (QoQ)
% Change
3Q F
0.60
2:30 PMIndia
RBI Repo rate
%
Dec 6
6.00
2:30 PMIndia
RBI Cash Reserve ratio
%
Dec 6
4.00
Dec 08, 2017
India
Imports YoY%
% Change
Nov
7.60
India
Exports YoY%
% Change
Nov
(1.10)
3:00 PMUK
Industrial Production (YoY)
% Change
Oct
2.50
China
Exports YoY%
% Change
Nov
6.90
7:00 PMUS
Change in Nonfarm payrolls
Thousands
Nov
261.00
7:00 PMUS
Unnemployment rate
%
Nov
4.10
Source: Bloomberg, Angel Research
Market Outlook
November 17, 2017
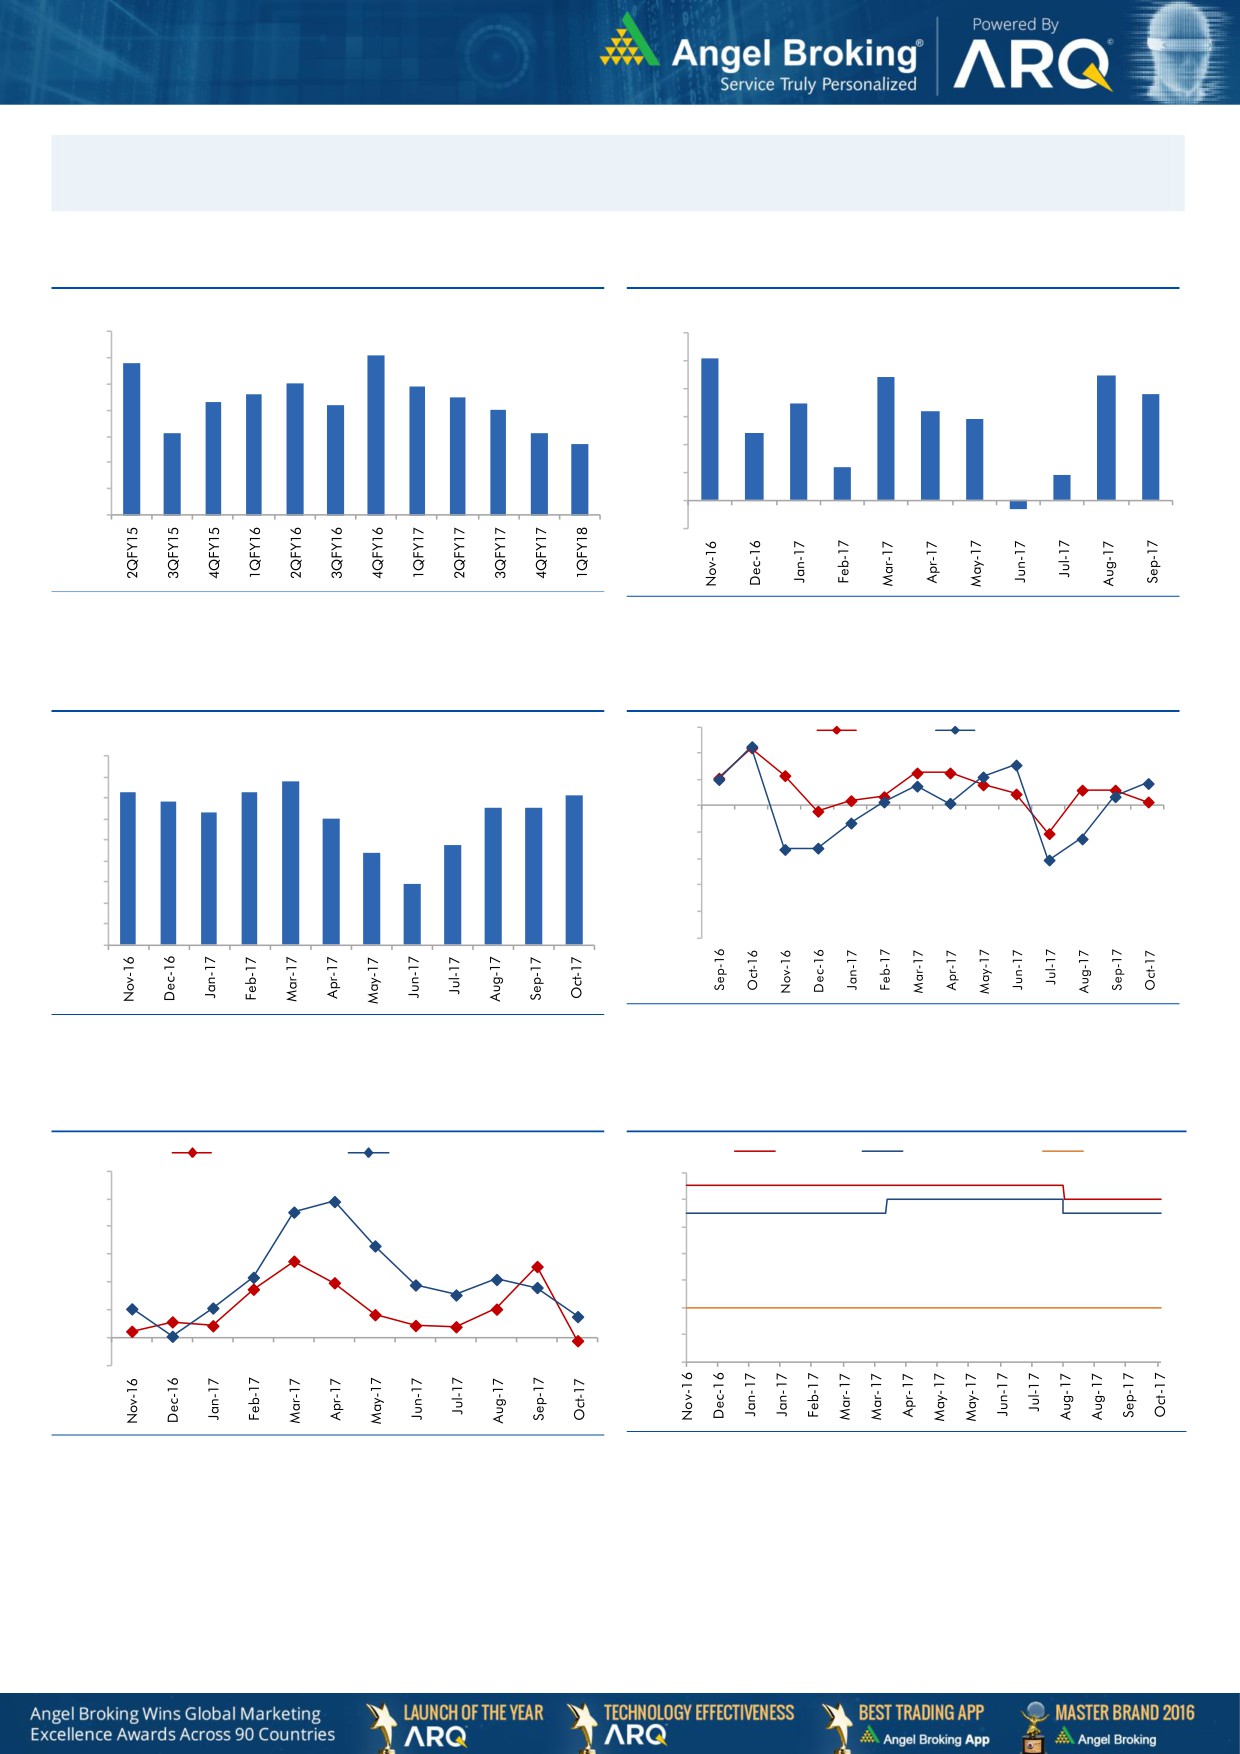
Macro watch
Exhibit 1: Quarterly GDP trends
Exhibit 2: IIP trends
(%)
(%)
10.0
6.0
9.1
5.1
8.8
9.0
5.0
4.4
4.5
8.0
7.9
7.6
7.5
3.8
8.0
7.3
7.2
3.5
7.0
4.0
3.2
2.9
7.0
6.1
6.1
3.0
2.4
5.7
6.0
2.0
1.2
5.0
0.9
1.0
4.0
-
3.0
(1.0)
(0.3)
Source: CSO, Angel Research
Source: MOSPI, Angel Research
Exhibit 3: Monthly CPI inflation trends
Exhibit 4: Manufacturing and services PMI
56.0
Mfg. PMI
Services PMI
(%)
4.5
54.0
3.9
4.0
3.6
3.7
3.6
52.0
3.4
3.3
3.3
3.5
3.2
3.0
50.0
3.0
2.4
48.0
2.5
2.2
2.0
46.0
1.5
1.5
44.0
1.0
42.0
0.5
40.0
-
Source: Market, Angel Research; Note: Level above 50 indicates expansion
Source: MOSPI, Angel Research
Exhibit 5: Exports and imports growth trends
Exhibit 6: Key policy rates
(%)
Exports yoy growth
Imports yoy growth
(%)
Repo rate
Reverse Repo rate
CRR
60.0
6.50
50.0
6.00
40.0
5.50
30.0
5.00
20.0
4.50
10.0
4.00
0.0
3.50
(10.0)
3.00
Source: Bloomberg, Angel Research
Source: RBI, Angel Research
Market Outlook
November 17, 2017
Global watch
Exhibit 1: Latest quarterly GDP Growth (%, yoy) across select developing and developed countries
(%)
8.0
6.9
7.0
5.8
6.0
5.3
5.0
5.0
1.1
3.7
4.0
2.5
3.0
2.2
1.8
2.0
1.5
1.4
0.8
1.0
0.3
-
Source: Bloomberg, Angel Research
Exhibit 2: 2017 GDP Growth projection by IMF (%, yoy) across select developing and developed countries
(%)
6.7
6.8
7.0
6.0
5.4
5.2
5.0
3.7
4.0
3.0
1.8
2.2
2.0
1.7
1.6
2.0
0.7
1.5
0.7
1.0
-
Source: IMF, Angel Research
Exhibit 3: One year forward P-E ratio across select developing and developed countries
(x)
25.0
20.0
15.0
10.0
5.0
-
Source: IMF, Angel Research
Market Outlook
November 17, 2017
Exhibit 4: Relative performance of indices across globe
Returns (%)
Country
Name of index
Closing price
1M
3M
1YR
Brazil
Bovespa
72,512
(5.8)
6.2
22.5
Russia
Micex
2,133
1.2
9.8
4.6
India
Nifty
10,215
(0.2)
4.3
26.0
China
Shanghai Composite
3,399
0.1
4.6
8.3
South Africa
Top 40
53,379
3.6
8.8
22.8
Mexico
Mexbol
47,748
(4.0)
(6.4)
7.6
Indonesia
LQ45
1,007
3.0
3.5
9.9
Malaysia
KLCI
1,718
(2.1)
(2.8)
3.3
Thailand
SET 50
1,077
(1.6)
7.8
13.9
USA
Dow Jones
23,458
2.0
7.9
24.1
UK
FTSE
7,387
(1.7)
(0.0)
9.0
Japan
Nikkei
22,351
5.2
13.2
28.9
Germany
DAX
13,047
0.3
6.4
22.1
France
CAC
5,336
(0.5)
4.3
17.5
Source: Bloomberg, Angel Research p68in4
Stock Watch
November 17, 2017
Company Name
Reco
CMP
Target
Mkt Cap
Sales ( Čcr )
OPM(%)
EPS (Č)
PER(x)
P/BV(x)
RoE(%)
EV/Sales(x)
(Č)
Price ( Č)
( Č cr )
FY18E FY19E
FY18E
FY19E
FY18E
FY19E
FY18E
FY19E
FY18E
FY19E
FY18E
FY19E
FY18E
FY19E
Agri / Agri Chemical
Rallis
Reduce
225
209
4,372
1,873
2,099
15.0
15.0
9.5
10.5
23.7
21.4
3.6
3.3
15.8
16.0
2.2
2.0
United Phosphorus
Accumulate
731
820
37,143
18,922
21,949
18.0
18.5
36.2
45.6
20.2
16.0
4.2
3.5
22.7
23.8
2.1
1.8
Auto & Auto Ancillary
Ashok Leyland
Accumulate
114
127
33,442
23,339
27,240
10.1
10.8
4.7
6.2
24.6
18.4
4.9
4.3
20.0
23.6
1.4
1.2
Bajaj Auto
Neutral
3,210
-
92,875
23,936
27,955
19.5
20.1
142.7
167.3
22.5
19.2
4.9
4.4
21.8
22.8
3.5
2.9
Bharat Forge
Buy
698
875
32,514
7,637
8,755
21.7
23.2
36.1
47.3
19.4
14.8
3.5
3.0
18.5
20.8
4.1
3.5
Eicher Motors
Neutral
30,399
-
82,754
19,043
22,837
19.5
19.9
835.4
1,019.0
36.4
29.8
13.6
10.5
40.9
37.8
4.2
3.5
Gabriel India
Neutral
195
-
2,796
1,782
2,033
9.7
10.2
7.1
8.9
27.4
22.0
5.5
4.7
21.0
22.2
1.5
1.3
Hero Motocorp
Accumulate
3,662
4,129
73,121
32,239
36,878
16.0
15.6
184.4
206.5
19.9
17.7
6.2
5.5
31.3
30.7
2.1
1.8
Jamna Auto Industries Neutral
61
-
2,419
1,441
1,662
14.4
14.8
13.9
17.6
4.4
3.5
1.2
1.0
30.0
31.0
1.7
1.4
Mahindra and Mahindra Neutral
1,415
-
87,956
46,971
53,816
13.6
14.0
67.7
79.8
20.9
17.7
3.0
2.7
15.0
15.9
1.8
1.5
Maruti
Accumulate
8,166
8,890
246,664
80,985
97,917
15.6
16.9
282.3
370.4
28.9
22.0
6.3
5.1
21.8
23.1
2.7
2.1
Minda Industries
Neutral
1,031
-
8,914
4,328
5,084
11.0
11.9
27.3
36.4
37.9
28.3
8.0
6.3
23.1
25.6
2.1
1.8
Motherson Sumi
Neutral
359
-
75,607
55,937
64,445
10.8
11.4
16.9
21.1
21.3
17.1
4.8
4.9
25.2
25.4
1.4
1.2
Tata Motors
Neutral
414
-
119,392
303,167
343,649
11.8
13.8
33.1
54.7
12.5
7.6
2.0
1.6
16.9
23.0
0.4
0.4
TVS Motor
Neutral
705
-
33,508
13,992
16,216
9.0
9.4
17.1
20.3
41.4
34.7
11.0
8.5
29.7
27.7
2.3
2.0
Amara Raja Batteries
Accumulate
793
858
13,541
6,140
7,122
14.3
15.6
29.3
39.0
27.1
20.3
4.6
3.9
17.1
19.0
2.2
1.9
Exide Industries
Neutral
198
-
16,817
8,689
9,854
15.1
15.2
9.7
11.0
20.5
18.0
3.6
3.2
15.7
16.1
1.7
1.5
Apollo Tyres
Neutral
233
-
13,343
15,739
17,326
13.3
14.6
20.4
26.7
11.4
8.7
1.4
1.2
20.4
26.7
1.1
1.0
Ceat
Neutral
1,771
-
7,163
6,661
7,717
11.1
14.2
116.2
178.2
15.2
9.9
2.6
2.2
15.2
21.3
1.2
1.0
JK Tyres
Neutral
145
-
3,279
8,318
9,239
16.2
16.4
21.0
27.5
6.9
5.3
1.3
1.1
19.1
20.4
0.8
0.7
Swaraj Engines
Neutral
1,922
-
2,387
788
889
16.4
16.5
71.6
81.0
26.8
23.7
7.7
7.2
29.6
31.0
2.7
2.3
Subros
Neutral
243
-
1,456
1,855
2,135
11.6
11.8
10.3
14.7
23.7
16.6
3.6
3.1
15.8
19.1
1.0
0.9
Capital Goods
BEML
Neutral
1,633
-
6,801
4,286
5,194
7.1
8.2
42.9
58.1
38.1
28.1
3.1
2.8
7.6
8.7
1.6
1.3
Bharat Electronics
Neutral
180
-
44,164
10,258
12,470
19.6
19.5
7.3
8.6
24.6
20.9
0.5
0.4
20.4
21.9
3.8
3.1
Voltas
Neutral
614
-
20,321
6,778
8,004
9.6
11.0
17.1
22.4
35.9
27.4
8.6
7.5
17.7
19.8
2.7
2.3
BHEL
Neutral
88
-
32,217
33,200
39,167
6.8
9.5
6.2
11.2
14.2
7.8
0.7
0.6
4.6
8.0
0.5
0.4
Blue Star
Buy
698
867
6,690
5,220
6,207
6.3
6.6
16.8
22.3
41.5
31.3
8.3
7.3
19.9
23.3
1.2
1.0
CG Power and Industrial
Neutral
80
-
5,042
6,555
7,292
7.5
7.5
-
0.8
8,045.0
100.6
1.3
1.3
0.1
1.2
0.9
0.8
Solutions
Greaves Cotton
Neutral
120
-
2,922
1,778
1,993
14.7
15.1
8.1
9.1
14.8
13.2
3.3
3.1
21.8
23.6
1.4
1.2
Stock Watch
November 17, 2017
Company Name
Reco
CMP
Target
Mkt Cap
Sales ( Čcr )
OPM(%)
EPS (Č)
PER(x)
P/BV(x)
RoE(%)
EV/Sales(x)
(Č)
Price ( Č)
( Č cr )
FY18E FY19E
FY18E
FY19E
FY18E
FY19E
FY18E
FY19E
FY18E
FY19E
FY18E
FY19E
FY18E
FY19E
Capital Goods
KEC International
Buy
298
350
7,650
9,779
11,113
9.4
9.8
14.2
18.2
21.0
16.4
4.0
3.3
21.1
22.1
1.0
0.9
KEI Industries
Accumulate
339
380
2,654
3,001
3,391
10.0
10.0
13.0
16.1
26.0
21.0
4.7
3.9
18.2
18.7
1.1
0.9
Thermax
Neutral
1,032
-
12,297
4,125
4,747
10.3
10.8
26.7
31.5
38.7
32.8
4.3
4.0
11.2
12.0
2.7
2.4
VATech Wabag
Buy
548
681
2,991
3,867
4,126
9.6
10.0
34.9
39.8
15.7
13.8
2.6
2.2
17.7
17.5
0.8
0.7
Cement
ACC
Neutral
1,787
-
33,563
12,255
13,350
13.5
14.3
58.0
66.2
30.8
27.0
3.7
3.4
11.5
12.2
2.7
2.5
Ambuja Cements
Neutral
275
-
54,595
10,250
11,450
17.5
19.0
7.2
8.3
38.2
33.1
2.7
2.6
7.0
7.8
5.1
4.5
India Cements
Neutral
172
-
5,308
6,135
6,750
14.8
15.2
8.5
11.5
20.3
15.0
1.0
1.0
4.8
6.2
1.2
1.1
JK Cement
Neutral
1,069
-
7,475
4,150
4,775
19.2
20.0
49.0
63.5
21.8
16.8
3.5
3.0
17.0
18.5
2.2
1.9
J K Lakshmi Cement
Neutral
434
-
5,112
3,422
3,757
15.5
17.0
13.5
23.2
32.2
18.7
3.3
2.9
10.8
15.5
1.9
1.7
Orient Cement
Neutral
162
-
3,311
2,215
3,233
16.8
17.0
5.9
6.9
27.4
23.4
2.1
1.9
10.8
10.1
2.5
1.7
UltraTech Cement
Neutral
4,277
-
117,427
28,250
35,150
20.2
23.5
77.5
122.2
55.2
35.0
4.7
4.2
9.6
14.8
4.6
3.7
Construction
KNR Constructions
Neutral
261
-
3,667
1,846
2,203
14.5
14.5
12.1
13.7
21.6
19.1
1.2
1.0
17.5
16.7
2.0
1.7
Larsen & Toubro
Neutral
1,218
-
170,523
95,787
109,476
10.2
11.6
44.5
50.8
27.4
24.0
3.4
3.2
12.9
13.1
2.3
2.1
Gujarat Pipavav Port
Neutral
135
-
6,505
739
842
61.6
62.7
5.1
6.2
26.4
21.9
3.3
3.2
12.7
14.9
8.3
7.1
PNC Infratech
Neutral
178
-
4,574
2,040
2,935
13.0
13.0
6.4
9.0
27.9
19.8
0.7
0.6
9.7
12.2
2.2
1.6
Simplex Infra
Neutral
504
-
2,494
6,012
6,619
11.6
11.7
21.1
31.0
24.0
16.3
1.7
1.5
6.5
8.6
0.9
0.9
Sadbhav Engineering
Neutral
316
-
5,413
3,823
4,426
10.7
10.8
10.3
11.8
30.6
26.7
3.7
3.2
10.1
10.5
1.7
1.5
NBCC
Neutral
266
-
23,945
9,099
12,706
6.4
6.4
7.3
9.6
36.6
27.8
1.6
1.3
27.5
30.5
2.5
1.8
MEP Infra
Neutral
101
-
1,644
2,403
2,910
18.3
16.8
2.4
6.1
43.0
16.6
16.3
11.0
35.2
55.8
1.8
1.5
SIPL
Neutral
122
-
4,301
2,060
2,390
46.8
47.7
(5.8)
(3.1)
4.6
5.2
(14.2)
(2.3)
6.8
6.4
Engineers India
Neutral
184
-
12,406
1,795
2,611
21.1
22.4
5.9
8.1
31.2
22.7
2.2
2.2
12.9
16.1
5.3
3.5
Financials
Axis Bank
Accumulate
543
580
130,107
32,558
35,843
3.5
3.2
27.8
41.0
19.5
13.2
2.1
1.9
11.4
14.9
-
-
Bank of Baroda
Neutral
183
-
42,051
22,533
26,079
2.4
2.4
12.0
20.9
15.2
8.7
1.0
0.9
6.6
11.0
-
-
Canara Bank
Neutral
384
-
22,960
17,925
20,235
2.0
2.1
18.5
36.5
20.8
10.5
0.8
0.7
3.4
6.2
-
-
Can Fin Homes
Neutral
452
-
6,010
586
741
3.5
3.5
107.8
141.0
4.2
3.2
0.9
0.7
24.1
25.6
-
-
Cholamandalam Inv. &
Neutral
1,299
-
20,311
2,826
3,307
6.3
6.3
53.7
64.6
24.2
20.1
4.1
3.5
18.3
18.9
-
-
Fin. Co.
Dewan Housing Finance Accumulate
624
712
19,553
2,676
3,383
2.4
2.7
37.4
49.7
16.7
12.6
2.2
1.9
13.8
16.2
-
-
Equitas Holdings
Buy
139
235
4,704
1,125
1,380
9.6
9.8
1.5
6.0
92.4
23.1
2.1
2.0
2.4
8.2
-
-
Federal Bank
Accumulate
112
125
21,967
4,896
5,930
2.8
3.1
5.4
7.6
20.9
14.8
1.8
1.6
8.5
11.0
-
-
Stock Watch
November 17, 2017
Company Name
Reco
CMP
Target
Mkt Cap
Sales ( Čcr )
OPM(%)
EPS (Č)
PER(x)
P/BV(x)
RoE(%)
EV/Sales(x)
(Č)
Price ( Č)
( Č cr )
FY18E FY19E
FY18E
FY19E
FY18E
FY19E
FY18E
FY19E
FY18E
FY19E
FY18E
FY19E
FY18E
FY19E
Financials
GIC Housing
Buy
422
655
2,275
376
477
3.6
3.7
33.0
40.0
12.8
10.6
2.3
1.9
20.0
23.0
-
-
HDFC Bank
Neutral
1,806
-
466,912
55,236
63,253
4.5
4.4
68.9
82.4
26.2
21.9
4.6
3.8
18.7
18.5
-
-
ICICI Bank
Neutral
319
-
204,842
42,361
51,378
3.6
3.9
18.4
25.7
17.4
12.4
1.9
1.8
11.3
15.0
-
-
Karur Vysya Bank
Buy
118
180
7,110
3,289
3,630
3.7
3.9
10.8
14.1
10.9
8.4
1.3
1.2
12.5
14.7
-
-
LIC Housing Finance
Accumulate
583
630
29,442
4,895
6,332
3.4
3.7
50.7
66.8
11.5
8.7
2.3
1.9
21.7
23.8
-
-
Punjab Natl.Bank
Neutral
189
-
40,314
23,708
25,758
2.1
2.1
5.9
16.4
32.2
11.5
1.0
0.9
3.0
8.3
-
-
RBL Bank
Neutral
508
-
21,127
2,309
2,888
2.6
2.5
16.4
19.1
31.0
26.6
3.9
3.5
13.3
13.8
-
-
Repco Home Finance
Buy
621
825
3,884
496
597
4.4
4.2
38.5
48.7
16.1
12.7
2.9
2.4
19.6
20.6
-
-
South Ind.Bank
Neutral
30
-
5,494
3,195
3,567
3.0
3.1
3.0
3.8
10.1
8.0
1.0
0.9
10.5
11.9
-
-
St Bk of India
Neutral
333
-
287,836
105,827
121,056
2.4
2.5
16.1
25.6
20.7
13.0
1.6
1.5
6.6
9.9
-
-
Union Bank
Neutral
173
-
12,593
14,650
16,225
2.3
2.3
23.1
32.5
7.5
5.3
0.6
0.5
7.1
9.2
-
-
Yes Bank
Neutral
302
-
69,179
11,088
13,138
3.0
2.9
84.0
99.3
3.6
3.0
0.6
0.5
16.3
16.8
-
-
FMCG
Akzo Nobel India
Neutral
1,765
-
8,467
3,164
3,607
13.8
13.7
58.6
67.9
30.1
26.0
7.4
6.5
24.5
25.1
2.5
2.2
Asian Paints
Neutral
1,180
-
113,190
17,603
20,615
18.6
18.6
2,128.9
2,543.3
0.6
0.5
11.7
9.8
28.0
28.9
6.2
5.2
Britannia
Neutral
4,734
-
56,839
9,690
11,278
14.8
15.4
84.0
101.0
56.4
46.9
20.5
16.3
40.6
39.0
5.8
5.0
Colgate
Neutral
1,038
-
28,227
4,420
5,074
24.9
25.3
28.6
32.8
36.3
31.6
14.3
11.6
43.8
40.5
6.1
5.3
Dabur India
Neutral
340
-
59,804
8,346
9,344
19.6
19.9
7.8
9.0
43.5
37.7
8.8
7.9
25.2
24.8
6.8
6.0
GlaxoSmith Con*
Neutral
6,030
-
25,360
5,072
5,760
18.2
18.4
176.3
199.2
34.2
30.3
7.3
6.6
21.2
21.7
4.3
3.8
Godrej Consumer
Neutral
931
-
63,459
10,171
11,682
20.8
21.5
21.7
27.1
42.9
34.4
9.7
8.3
22.3
23.4
6.4
5.5
HUL
Neutral
1,277
-
276,317
37,077
41,508
20.3
21.8
5,189.9
6,318.5
0.3
0.2
38.9
33.2
74.8
82.0
7.3
6.5
ITC
Neutral
255
-
310,791
44,588
49,853
37.0
37.3
9.6
11.0
26.6
23.2
6.5
6.2
25.1
27.3
6.5
5.7
Marico
Neutral
304
-
39,259
6,788
7,766
18.5
19.2
7.1
8.5
42.8
35.8
15.0
12.8
36.9
38.0
5.6
4.9
Nestle*
Neutral
7,660
-
73,851
10,083
11,182
20.0
20.9
119.7
141.3
64.0
54.2
225.5
206.1
36.7
39.8
7.0
6.3
Tata Global
Neutral
252
-
15,901
7,121
7,641
11.9
12.3
6.9
8.0
36.5
31.5
2.4
2.3
6.8
7.2
2.0
1.9
Procter & Gamble
Neutral
8,855
-
28,744
3,034
3,579
27.1
27.7
167.7
198.8
52.8
44.5
14.2
12.2
28.8
29.5
8.9
7.5
Hygiene
IT
HCL Tech^
Buy
851
1,014
121,422
50,009
54,608
22.1
22.1
62.8
67.6
13.6
12.6
3.0
2.6
22.4
20.6
2.1
1.8
Infosys
Accumulate
989
1,120
227,081
70,333
75,960
26.0
26.0
61.7
65.9
16.0
15.0
3.0
2.8
18.9
18.7
2.6
2.4
TCS
Reduce
2,747
2,442
525,778
123,384
134,488
26.1
26.1
133.2
143.7
20.6
19.1
5.7
5.3
27.6
27.8
3.9
3.5
Tech Mahindra
Accumulate
499
526
48,683
30,545
32,988
15.0
15.0
35.2
37.6
14.2
13.3
2.4
2.2
16.8
16.2
1.4
1.2
Stock Watch
November 17, 2017
Company Name
Reco
CMP
Target
Mkt Cap
Sales ( Čcr )
OPM(%)
EPS (Č)
PER(x)
P/BV(x)
RoE(%)
EV/Sales(x)
(Č)
Price ( Č)
( Č cr )
FY18E FY19E
FY18E
FY19E
FY18E
FY19E
FY18E
FY19E
FY18E
FY19E
FY18E
FY19E
FY18E
FY19E
IT
Wipro
Neutral
298
-
144,857
54,164
56,544
22.3
22.3
18.8
19.5
15.8
15.3
2.5
2.2
15.0
13.6
1.9
1.7
Media
D B Corp
Neutral
366
-
6,735
2,404
2,625
30.5
31.5
23.7
26.9
15.5
13.6
3.6
3.1
23.5
22.8
2.6
2.4
HT Media
Neutral
97
-
2,262
2,589
2,830
15.1
15.4
8.3
10.9
11.7
8.9
1.0
0.9
8.4
10.4
0.4
0.3
Jagran Prakashan
Buy
164
225
5,363
2,541
2,835
28.5
28.7
12.7
14.1
12.9
11.6
2.7
2.3
21.3
21.4
2.0
1.7
Sun TV Network
Neutral
845
-
33,294
3,238
3,789
51.9
55.1
30.9
38.0
27.3
22.2
7.8
6.8
30.0
31.0
9.8
8.3
Hindustan Media
Neutral
239
-
1,756
1,002
1,074
23.3
23.5
29.2
33.8
8.2
7.1
1.3
1.1
15.6
15.4
0.8
0.5
Ventures
TV Today Network
Buy
352
435
2,098
667
727
27.7
27.7
18.6
20.1
18.9
17.5
2.9
3.0
15.6
17.3
2.7
2.5
Music Broadcast Limited Buy
370
434
2,111
271
317
91.0
109.0
6.0
10.0
61.7
37.0
3.9
3.5
6.5
9.3
7.4
6.1
Metals & Mining
Coal India
Neutral
269
-
166,948
82,301
91,235
17.0
18.0
17.1
20.5
15.7
13.1
3.0
2.8
45.0
55.0
1.7
1.5
Hind. Zinc
Neutral
302
-
127,520
22,108
24,555
57.0
58.0
22.1
26.3
13.7
11.5
4.4
3.6
32.0
35.0
4.8
4.0
Hindalco
Neutral
255
-
57,320
102,350
105,355
13.5
14.5
21.5
24.5
11.9
10.4
1.6
1.4
15.0
15.2
1.1
1.1
JSW Steel
Neutral
259
-
62,558
64,500
68,245
21.1
21.5
20.1
21.2
12.9
12.2
2.4
2.0
-
-
1.7
1.6
NMDC
Neutral
124
-
39,137
10,209
11,450
47.0
48.0
11.1
12.1
11.1
10.2
1.5
1.5
-
-
3.3
3.0
SAIL
Neutral
77
-
31,926
54,100
63,555
3.0
10.0
(10.0)
1.5
51.5
1.0
1.0
-
-
1.6
1.4
Vedanta
Neutral
301
-
111,999
81,206
87,345
28.0
29.0
26.5
33.5
11.4
9.0
2.6
2.2
-
-
2.1
1.8
Tata Steel
Neutral
687
-
66,689
121,445
126,500
16.2
17.2
65.4
81.3
10.5
8.5
1.7
1.4
-
-
1.1
0.9
Oil & Gas
GAIL
Neutral
448
-
75,728
53,115
52,344
14.2
15.3
30.0
31.1
14.9
14.4
1.9
1.7
-
-
1.2
1.1
ONGC
Neutral
179
-
230,164
83,111
84,934
44.2
44.9
16.4
16.9
10.9
10.6
1.3
1.2
-
-
2.6
2.6
Indian Oil Corp
Neutral
393
-
190,837
396,116
432,560
8.5
8.8
40.1
42.2
9.8
9.3
1.7
1.5
-
-
0.6
0.6
Reliance Industries
Neutral
902
-
586,936
257,711
267,438
17.0
18.2
89.1
89.5
10.1
10.1
0.9
0.9
-
-
1.9
1.9
Pharmaceuticals
Alembic Pharma
Buy
518
600
9,763
3,903
4,584
18.2
19.2
21.8
27.2
23.8
19.0
4.3
3.6
19.8
20.6
2.5
2.2
Alkem Laboratories Ltd
Accumulate
1,967
2,125
23,515
6,320
7,341
17.5
19.8
72.7
96.6
27.1
20.4
4.8
4.0
16.7
18.7
3.7
3.1
Aurobindo Pharma
Buy
713
823
41,779
17,086
19,478
22.1
22.0
44.7
51.4
16.0
13.9
3.5
2.9
24.7
22.7
2.6
2.2
Aventis*
Neutral
4,457
-
10,265
2,411
2,698
18.8
18.8
151.6
163.9
29.4
27.2
4.6
3.7
25.4
27.5
3.8
3.2
Cadila Healthcare
Neutral
443
-
45,347
11,584
13,228
20.3
20.4
18.7
21.3
23.7
20.8
5.3
4.3
24.6
22.9
3.7
3.2
Cipla
Sell
593
462
47,718
16,163
18,711
16.6
16.9
20.7
24.3
28.7
24.4
3.4
3.0
12.6
13.1
3.1
2.6
Dr Reddy's
Neutral
2,335
-
38,727
15,844
17,973
17.6
18.2
91.7
111.0
25.5
21.0
2.9
2.6
11.9
13.0
2.7
2.4
GSK Pharma*
Neutral
2,534
-
21,465
2,968
3,324
13.8
15.9
37.8
46.3
67.0
54.7
11.7
12.9
16.7
22.4
7.0
6.4
Indoco Remedies
Sell
269
153
2,479
1,154
1,310
14.9
14.9
11.3
12.7
23.8
21.2
3.4
3.0
15.0
15.0
2.3
1.9
Stock Watch
November 17, 2017
Company Name
Reco
CMP
Target
Mkt Cap
Sales ( Čcr )
OPM(%)
EPS (Č)
PER(x)
P/BV(x)
RoE(%)
EV/Sales(x)
(Č)
Price ( Č)
( Č cr )
FY18E FY19E
FY18E
FY19E
FY18E
FY19E
FY18E
FY19E
FY18E
FY19E
FY18E
FY19E
FY18E
FY19E
Pharmaceuticals
Ipca labs
Neutral
529
-
6,669
3,593
4,022
14.5
15.5
19.4
25.2
27.3
21.0
2.5
2.2
9.5
11.2
1.9
1.7
Lupin
Buy
829
1,091
37,475
16,240
18,562
21.3
21.7
42.5
49.6
19.5
16.7
2.5
2.2
13.3
13.7
2.4
2.0
Natco Pharma
Buy
895
1,057
15,611
1,886
2,016
32.3
29.5
23.2
22.0
38.7
40.6
8.1
7.2
20.9
17.6
8.1
7.6
Sun Pharma
Accumulate
509
558
122,038
32,899
36,451
26.9
25.4
31.6
32.3
16.1
15.8
2.8
2.5
18.7
18.8
3.3
2.9
Syngene International
Accumulate
507
556
10,148
1,394
1,818
33.0
36.0
15.8
20.6
32.1
24.6
6.0
4.9
18.6
20.0
7.3
5.6
Power
Tata Power
Neutral
85
-
22,936
32,547
33,806
20.5
20.5
4.7
5.4
18.0
15.9
1.7
1.5
10.5
10.5
1.7
1.6
NTPC
Neutral
177
-
145,697
86,070
101,246
28.3
30.7
12.9
16.2
13.7
10.9
1.4
1.3
10.6
12.4
3.1
2.7
Power Grid
Accumulate
208
223
109,052
29,183
32,946
89.7
90.0
18.0
20.8
11.6
10.0
1.9
1.7
17.7
18.2
7.7
7.1
Real Estate
Prestige Estate
Neutral
294
-
11,018
4,607
5,146
21.0
22.2
7.9
9.8
37.2
30.0
2.3
2.1
10.3
12.0
3.6
3.2
MLIFE
Buy
436
522
2,237
487
590
12.3
17.8
21.0
31.2
20.8
14.0
1.1
1.0
5.2
7.4
3.3
2.7
Telecom
Bharti Airtel
Neutral
490
-
195,833
97,903
105,233
36.0
36.3
9.3
11.1
52.7
44.3
2.5
2.4
5.0
5.6
3.0
2.7
Idea Cellular
Neutral
96
-
34,594
35,012
37,689
27.1
27.7
(4.4)
(2.7)
1.5
1.6
(6.8)
(4.6)
2.3
2.1
zOthers
Abbott India
Neutral
4,868
-
10,343
3,244
3,723
14.9
16.1
167.5
209.4
29.1
23.2
6.4
5.4
23.7
24.8
2.8
2.4
Asian Granito
Buy
480
570
1,443
1,169
1,286
12.5
12.5
16.0
19.7
30.0
24.3
3.2
2.8
10.7
11.6
1.5
1.3
Bajaj Electricals
Neutral
403
-
4,093
4,646
5,301
6.7
7.6
16.1
22.3
25.0
18.1
4.1
3.5
16.4
19.2
0.9
0.8
Banco Products (India)
Neutral
223
-
1,593
1,530
1,695
13.2
12.7
19.0
20.0
11.7
11.1
1.9
1.7
0.2
0.2
1.0
105.8
Coffee Day Enterprises
Neutral
219
-
4,520
3,494
3,913
17.4
18.0
4.8
5.7
-
38.5
1.9
1.9
-
0.1
1.8
1.5
Ltd
Elecon Engineering
Neutral
74
-
825
171
201
15.0
16.2
36.0
43.0
2.0
1.7
0.2
0.2
0.1
0.1
4.2
3.6
Garware Wall Ropes
Neutral
902
-
1,973
928
1,003
15.2
15.2
39.4
43.2
22.9
20.9
3.8
3.2
16.5
15.4
2.0
1.8
Goodyear India*
Neutral
823
-
1,897
1,717
1,866
11.8
12.3
47.9
49.8
17.2
16.5
2.7
2.3
15.6
15.7
0.8
114.6
Hitachi
Neutral
2,402
-
6,531
2,355
2,715
10.3
10.8
49.0
60.9
49.0
39.4
11.5
9.1
0.2
0.2
2.8
2.4
HSIL
Neutral
461
-
3,333
2,240
2,670
14.6
15.0
17.0
22.0
27.1
21.0
2.2
2.1
0.1
0.1
1.7
1.4
Interglobe Aviation
Neutral
1,165
-
44,742
22,570
27,955
14.2
15.0
63.6
81.8
18.3
14.3
9.6
8.1
0.5
0.6
1.7
1.3
Jyothy Laboratories
Neutral
330
-
5,994
1,781
2,044
14.1
15.0
9.4
10.5
35.3
31.4
7.5
7.1
0.2
0.2
3.6
3.1
Linc Pen & Plastics
Neutral
243
-
359
420
462
9.3
9.3
15.3
17.1
15.9
14.2
2.7
2.8
16.9
19.5
0.9
0.8
M M Forgings
Neutral
857
-
1,035
542
642
20.1
21.0
41.6
56.8
20.6
15.1
2.8
2.4
0.1
0.2
2.3
2.0
Mirza International
Neutral
152
-
1,828
1,148
1,285
18.0
18.0
8.0
9.4
18.9
16.3
3.1
2.6
16.3
16.1
1.8
1.5
Navkar Corporation
Buy
182
265
2,745
561
617
41.5
41.5
11.5
12.7
15.8
14.4
1.7
1.5
10.5
10.4
5.6
4.8
Nilkamal
Neutral
1,560
-
2,328
2,317
2,525
11.4
11.1
96.0
105.0
16.3
14.9
2.8
2.4
0.2
0.2
1.0
0.9
Stock Watch
November 17, 2017
Company Name
Reco
CMP
Target Mkt Cap
Sales ( Čcr )
OPM(%)
EPS (Č)
PER(x)
P/BV(x)
RoE(%)
EV/Sales(x)
(Č)
Price ( Č)
( Č cr )
FY18E FY19E FY18E FY19E FY18E FY19E FY18E FY19E FY18E FY19E FY18E FY19E FY18E FY19E
zOthers
Parag Milk Foods
Neutral
237
-
1,993
1,987
2,379
7.6
9.0
12.4
18.3
19.1
13.0
2.7
2.4
8.2
13.2
1.1
1.0
Radico Khaitan
Neutral
250
-
3,334
1,811
1,992
13.2
13.2
8.1
8.8
30.9
28.4
3.1
3.4
10.1
12.0
2.2
2.0
Relaxo Footwears
Neutral
570
-
6,850
1,981
2,310
13.7
14.5
12.0
15.5
47.5
36.8
9.3
7.5
0.2
0.2
3.5
3.0
Siyaram Silk Mills
Buy
557
650
2,609
1,769
1,981
12.7
12.7
22.6
26.2
24.6
21.2
3.8
3.3
15.5
15.5
1.7
1.5
Styrolution ABS India* Neutral
920
-
1,618
1,800
1,980
8.0
8.1
42.0
46.2
21.9
19.9
2.5
2.2
0.1
0.1
1.0
0.9
Surya Roshni
Neutral
368
-
1,611
4,870
5,320
7.7
7.8
22.8
28.1
16.2
13.1
2.1
1.9
0.1
0.1
0.6
0.5
TVS Srichakra
Neutral
3,319
-
2,541
2,729
2,893
12.7
12.5
248.5
265.0
13.4
12.5
3.8
3.1
0.3
0.3
0.9
0.9
Visaka Industries
Neutral
634
-
1,007
1,104
1,214
12.1
12.6
31.0
37.9
20.5
16.8
2.5
2.2
0.1
0.1
1.1
1.0
VIP Industries
Neutral
309
-
4,366
1,450
1,693
10.4
10.5
6.5
7.8
47.2
39.6
10.0
8.7
21.1
22.1
3.0
2.6
Navin Fluorine
Accumulate
680
730
3,354
945
1,154
22.4
22.6
28.7
34.8
23.7
19.6
3.9
3.4
-
-
3.1
2.4
Source: Company, Angel Research; Note: *December year end; #September year end; &October year end; Price as on November 16, 2017
Market Outlook
November 17, 2017
Research Team Tel: 022 - 39357800
DISCLAIMER
Angel Broking Private Limited (hereinafter referred to as “Angel”) is a registered Member of National Stock Exchange of India
Limited,Bombay Stock Exchange Limited and Metropolitan Stock Exchange Limited. It is also registered as a Depository Participant with
CDSL and Portfolio Manager with SEBI. It also has registration with AMFI as a Mutual Fund Distributor. Angel Broking Private Limited is a
registered entity with SEBI for Research Analyst in terms of SEBI (Research Analyst) Regulations, 2014 vide registration number
INH000000164. Angel or its associates has not been debarred/ suspended by SEBI or any other regulatory authority for accessing
/dealing in securities Market. Angel or its associates/analyst has not received any compensation / managed or
co-managed public offering of securities of the company covered by Analyst during the past twelve months.
This document is solely for the personal information of the recipient, and must not be singularly used as the basis of any investment
decision. Nothing in this document should be construed as investment or financial advice. Each recipient of this document should make
such investigations as they deem necessary to arrive at an independent evaluation of an investment in the securities of the companies
referred to in this document (including the merits and risks involved), and should consult their own advisors to determine the merits and
risks of such an investment.
Reports based on technical and derivative analysis center on studying charts of a stock's price movement, outstanding positions and
trading volume, as opposed to focusing on a company's fundamentals and, as such, may not match with a report on a company's
fundamentals. Investors are advised to refer the Fundamental and Technical Research Reports available on our website to evaluate the
contrary view, if any.
The information in this document has been printed on the basis of publicly available information, internal data and other reliable
sources believed to be true, but we do not represent that it is accurate or complete and it should not be relied on as such, as this
document is for general guidance only. Angel Broking Pvt. Limited or any of its affiliates/ group companies shall not be in any way
responsible for any loss or damage that may arise to any person from any inadvertent error in the information contained in this report.
Angel Broking Pvt. Limited has not independently verified all the information contained within this document. Accordingly, we cannot
testify, nor make any representation or warranty, express or implied, to the accuracy, contents or data contained within this document.
While Angel Broking Pvt. Limited endeavors to update on a reasonable basis the information discussed in this material, there may be
regulatory, compliance, or other reasons that prevent us from doing so.
This document is being supplied to you solely for your information, and its contents, information or data may not be reproduced,
redistributed or passed on, directly or indirectly.
Neither Angel Broking Pvt. Limited, nor its directors, employees or affiliates shall be liable for any loss or damage that may arise from
or in connection with the use of this information.